One reusable data layer
Centralising and transforming inputs means dashboard features can build on a consistent prepared dataset instead of re-solving source differences independently.
 ← Selected work
Jabar Digital Service · Case study
As a backend engineer, I worked on the data plumbing behind Jabar Dashboard: shaping inputs from many government sources into a central ETL pipeline that could support public dashboards and policy-facing insights.
The assignment
Make data from many places behave like one dependable platform.
The product
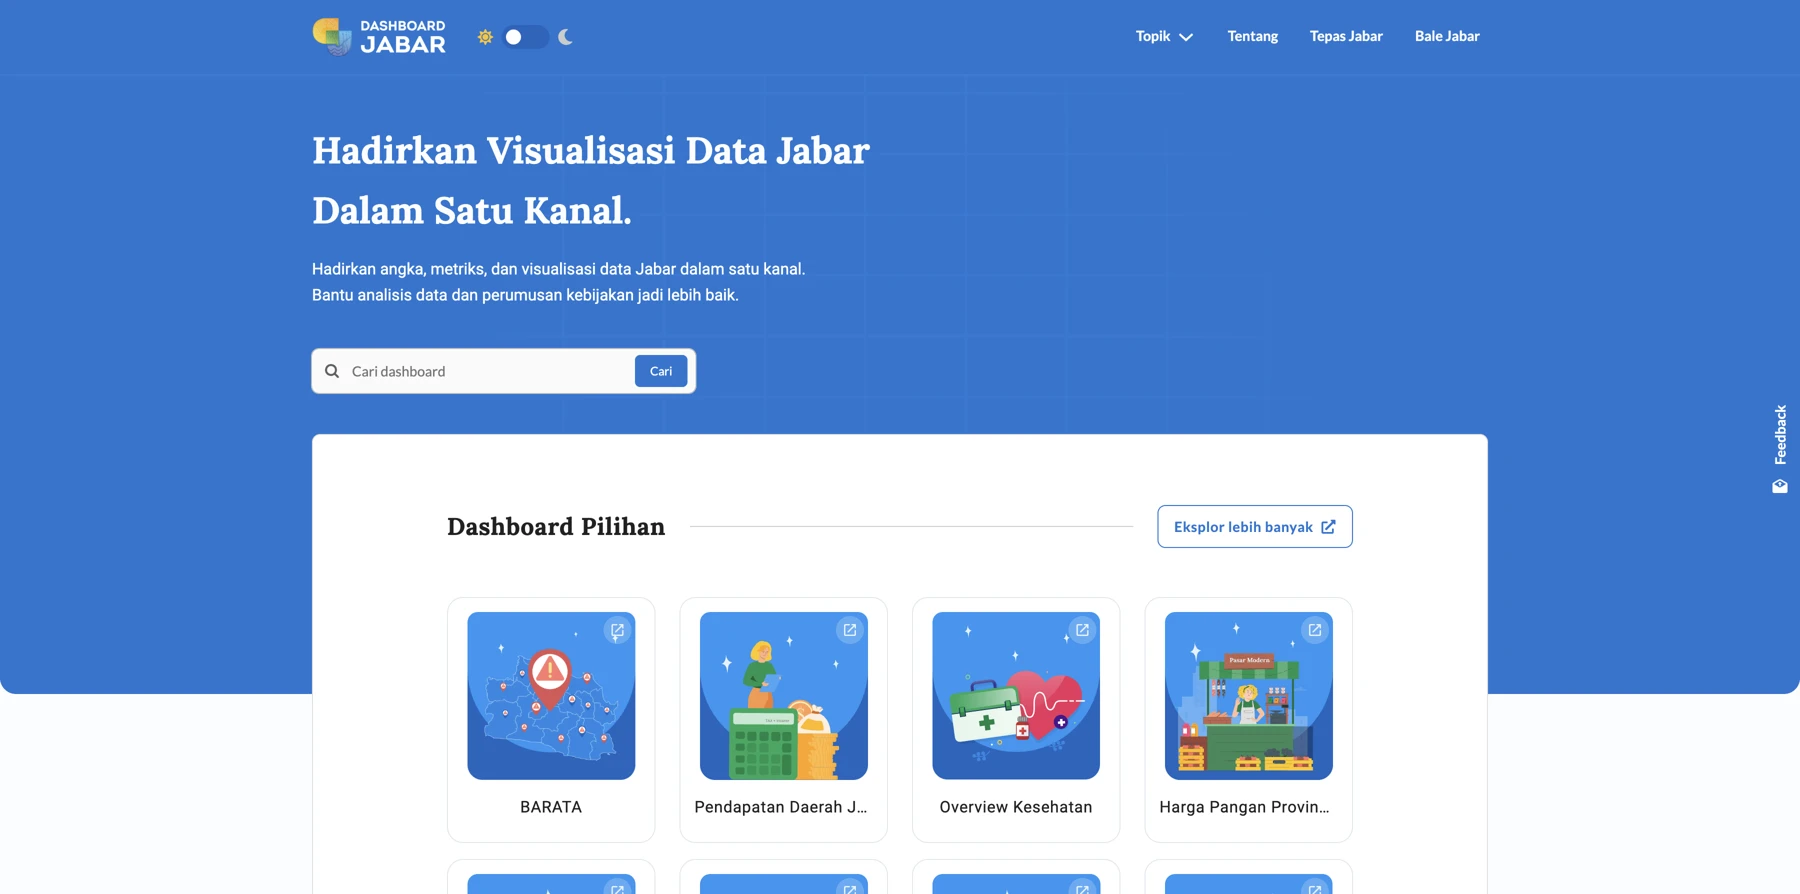
Jabar Dashboard presents West Java’s numbers, metrics, and visualisations in one public channel. It brings together featured dashboards, current highlights across topics such as population, health, education, and industry, and map-based exploration.
For citizens and public-sector teams, the point is not merely putting charts online. It is creating a more usable path from data to analysis and better-informed policy discussions.
Visit Jabar DashboardWho it was built for
The dashboard was shaped around the needs of government leaders, from heads of provincial departments (dinas) to the Governor of West Java. Alongside its public-facing role, it was intended to give leadership a clearer view of indicators across sectors and support data-informed policy discussions.
Department leaders need to understand the picture within their area of responsibility. At the provincial level, the governor needs a broader view across departments. Bringing those inputs together helps create a shared basis for reviewing conditions, discussing priorities, and coordinating next steps.
My contribution was on the backend: integrating data from multiple government sources and preparing consistent datasets for those views. That connected the pipeline work to its purpose—making fragmented records easier for decision-makers to understand and use.
01 / The system behind the screen
I worked on the backend journey that brings scattered government data together—so the dashboard can focus on making it useful.
Different owners.
Different data structures.
Turn source differences into a consistent data shape.
Centralised datasets, ready to reuse.
Dashboard APIs.
Metrics, maps, and visualisations.
Connecting sources, building ETL flows, and preparing PostgreSQL read models behind the public experience.
Challenge
Government data comes from many owners and systems, each with its own schema, conventions, update cadence, and level of completeness. That creates a gap between the source of a record and the public-facing view of it.
If every dashboard endpoint needs to rediscover where data lives, reshape it, and resolve the same joins at request time, the product becomes difficult to maintain and increasingly expensive to query as data grows. My responsibility was to help close that gap with a central data flow.
The result had to be understandable for teams publishing information and reliable enough that public visualisations could be backed by a consistent source of truth.
02 / The PostgreSQL decision
Materialized viewsWith millions of records and repeated joins, the useful question became: how much work can we move out of each dashboard request?
Each visit asks the database to assemble the same derived result again.
Dashboard requests reuse the prepared data instead of rebuilding those joins.
Less repeated computation on the request path, especially for predictable dashboard queries over large datasets.
A stored snapshot is only as fresh as its last refresh. Refresh timing needs to match how current the dashboard data must be.
My backend role
I built and maintained ETL-oriented flows: ingest data from source systems, clean and transform it into a consistent shape, apply rules needed for downstream use, and load it into central storage for the dashboard.
I also learned and applied PostgreSQL materialized views for read-heavy dashboard data. Precomputing the joined result makes the request path much lighter than repeating the same expensive joins for every dashboard load.
What this enabled
Centralising and transforming inputs means dashboard features can build on a consistent prepared dataset instead of re-solving source differences independently.
Precomputed materialized views reduce repeated join work for read-heavy endpoints, especially when data reaches millions of rows.
Separating ETL and refresh work from API requests gives the product a cleaner operational boundary: prepare deliberately, then serve predictably.
Reflection
An API response is the last step in a much longer system.
This work changed how I think about backend development: source ownership, ingestion, validation, transformation, storage, refresh timing, and finally a request that someone can understand all matter. Making an endpoint fast is useful; making the path to that endpoint repeatable is what lets a data product keep growing.
Working with PostgreSQL materialized views made that lesson concrete. For a known dashboard read pattern, preparing the right data shape early can make the system easier to reason about and more responsive for the people using it.